Tuesday, July 10, 2007
@ 5:56 PM
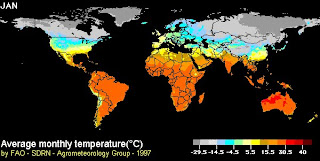
I like to inform you about my mistake on page 129 of the textbook. The map's legends are correct, the legends are correct to each region, as they are actually representing the TEMPERATURE RANGE, not the MEAN TEMPERATURE for each region. Nonetheless, do not worry about it, refer to my notes as it would give you a better description about climatic maps.Sunday, July 8, 2007
@ 5:46 PM
For the last part of the chapter 15 which I will be covering this week, climographs and wind rose are the more difficult ones to learn.
For the weather map, you must be able to evaluate what does wind speed, wind direction, rainfall and temperature will tell you about the atmosphere in the area. The next thing is to figure correctly what would possible happen in the next few hours based on the information present.
For example, If there is sky is cloudy, strong winds are present and the temperature is cooler than normal, what would possibly happen in the next few hours? If you say it is going to rain, you are on the right track. If you say otherwise, well I guess you better get out more and look at the sky more often. ;P
Next thing is climatic map or commonly known as climate map, please note that the legends of the climatic map on page 129 of your textbook is wrong, please ignore the entire map, you will get more confused reading it. Climatic maps are used to tell what kind of climate exist in the world or in regions of the world, such as the one below. They normally tell you about the temperature or the amount of rainfall in each area.
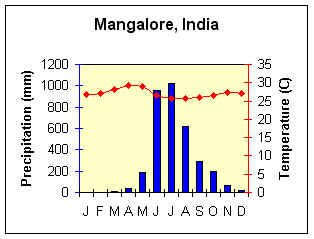
As for climographs, they are the most common charts used to describe the climate of a region over a period of one year. They normally tell you about total rainfall and mean temperature for each month of the year. It is hard to get accurate reading from them when you start calculating, but I will normally give a generous buffer in the deviation, so don't fret unnecessarily.
I recommend using a ruler to measure correctly, when finding the annual rainfall and the annual mean temperature. Try doing it first and you will get what I mean. Here is an example of a climograph, notice that the rainfall reading are the bars and the temperature are connected dots.
This site has alot of information that will help you in your studies about climographs. (Hint: also alot on chapter 16, use your textbook as reference)
Next up is the wind rose, unfortunately, I cannot explain in great detail here, as it will need some personal guidance, words just do not describe well how it works. Don't fret again, it is not hard. If you need some assistance to understand, this site will help you.
That is all for now, there will be an open book test on this chapter worth 20 marks. Do well in this because it will help you alot in the following class test and common test.